HowTo #3 – Monitor EPS (EN)
Hello, in this article we will discover how to monitor EPS (Event Per Second) of your QRadar infrastructure in a cool way. Indeed, if you want a healthy QRadar you need to monitor and have a good comprehension of EPS variation. In fact, many peak of logs can result into instabilities of your QRadar and good collection in general. In a more cybersecurity point of view, those peak can be a sign of malicious activities from third parties.
You will discover how to get a monitoring dashboard and how to use it. After that, you will be able to customize the dashboard to adapt it for your environment and every specificities.
You can retrieve the dashboard in my github repository here : https://raw.githubusercontent.com/staze0/QRadar/main/Pulse%20Dashboard/EPS%20Monitoring.json. Do not hesitate to leave a ⭐.
Note: You have to install Pulse application to import this dashboard.

2. HowTo
Now, this is what the dashboard looks like:
- Example 1
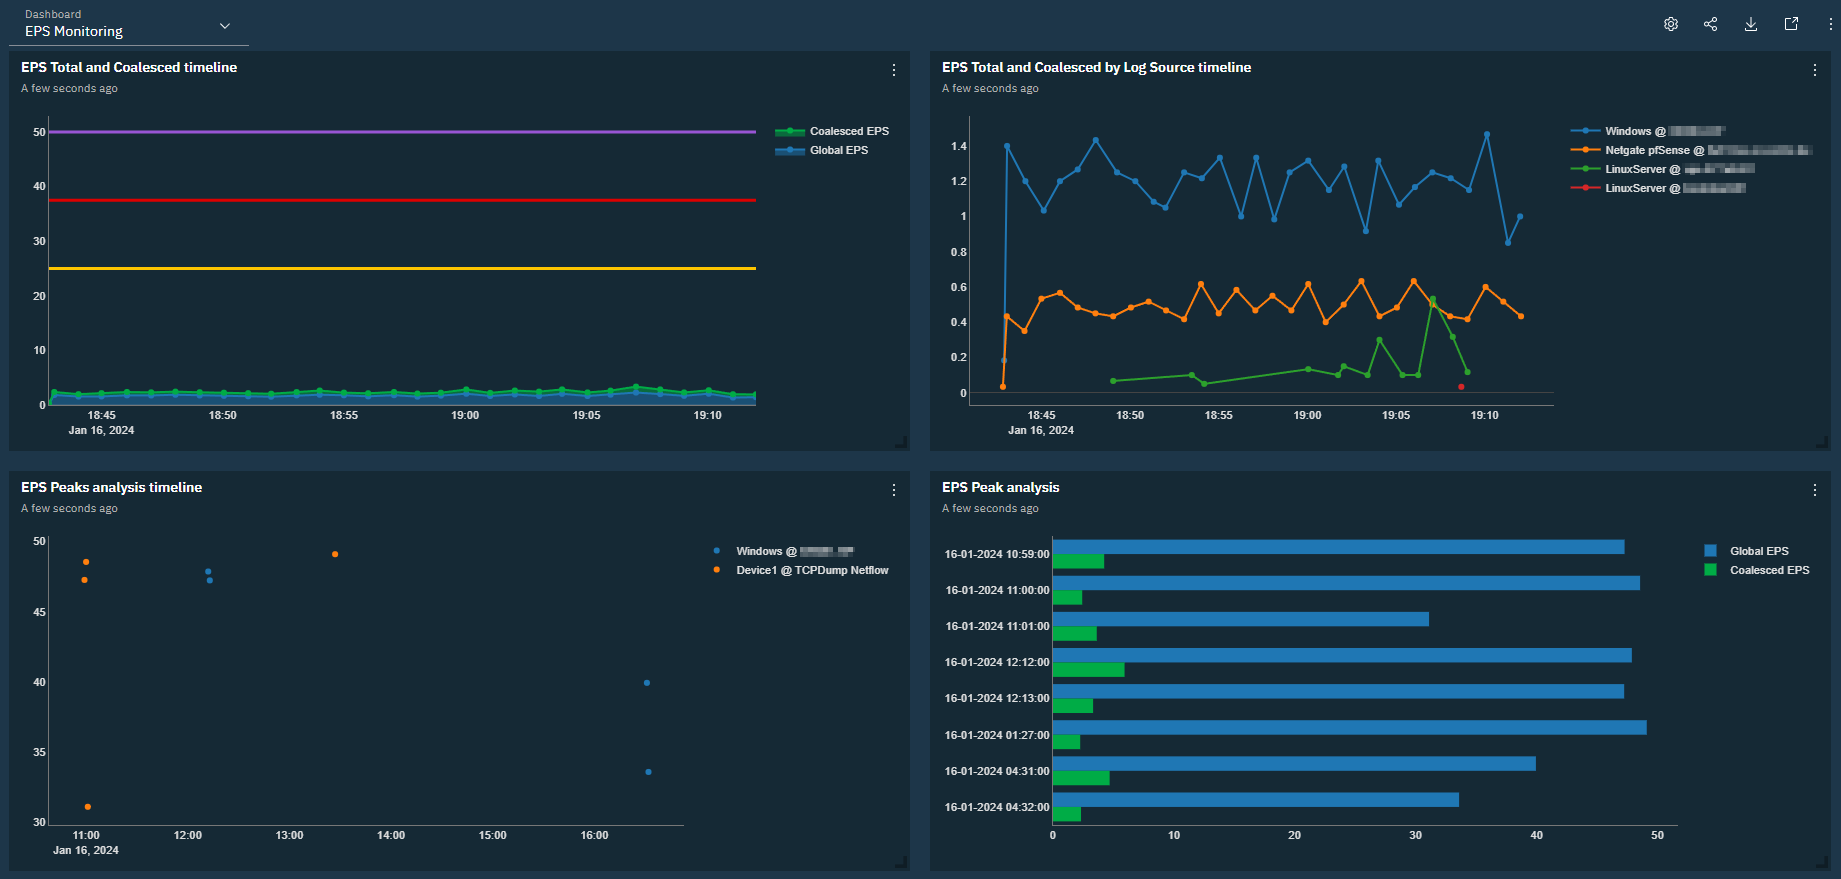
- Example 2
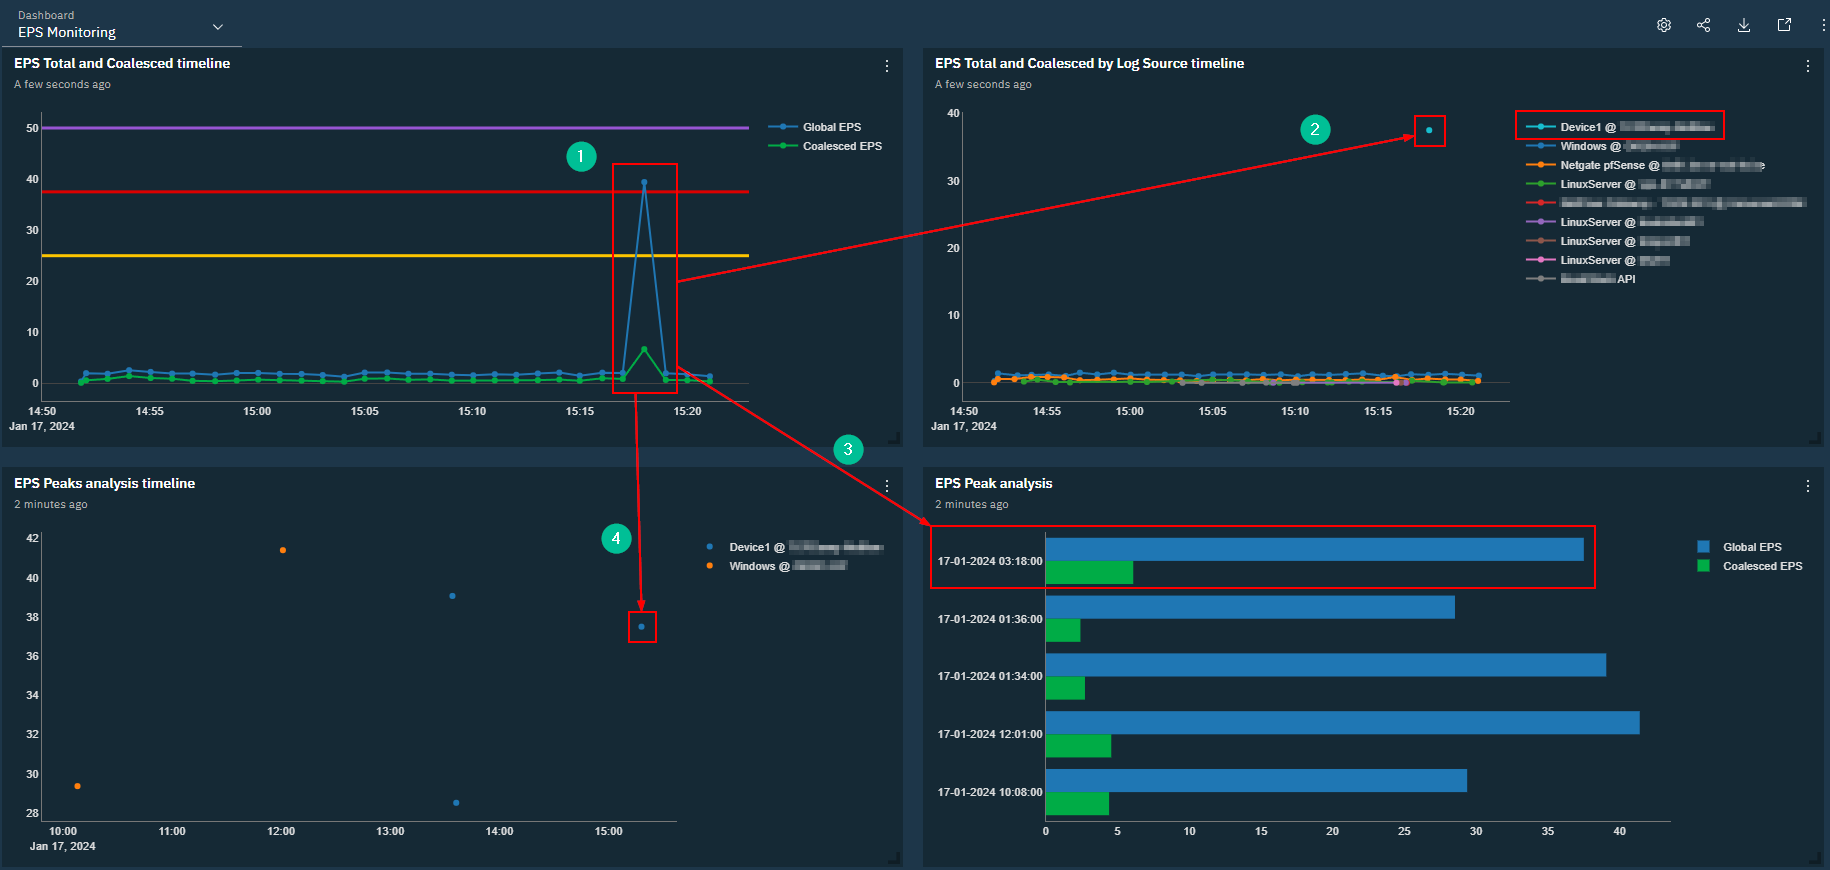
The dashboard is composed of 4 visuals, from left to right and top to bottom you have:
- “EPS Total and Coalesced timeline”: describe in a timeline view the evolution of the EPS in all your log sources. There are two sets of datas, one for the raw events and the other one for the coalesced events. Those events are raw events merged by QRadar collection process because they are similar to each other. Finally, you have 3 thresholds that represent 50%, 75% and 100% of my license.
- “EPS Total and Coalesced by Log Sources timeline”: describe in a timeline view the evolution of the EPS by log sources.
- “EPS Peaks analysis timeline”: describe in a timeline view EPS peaks. Those peaks are shown depending onthe parameter “Maximum EPS” and “Percentage of maximum EPS” of the dashboard and you put in. The first parameter defines the minimal number of EPS in all the log sources. Next, the second parameter defines the minimal number of EPS compared to the first parameter for a log source to be display. This second value is in percentage.
- “EPS Peak anlysis”: describe, for each point of the precedent visual, the number of raw events and the number of coalesced events.
QRadar: How does coalescing work in QRadar?
[…]
Event coalescing starts after three events have been found with matching properties within a 10 second window. Additional events that occur within the 10 second period are coalesced together, with a count of the events noted. For each record containing coalesced events, only the payload of the first coalesced event is retained.
[…]
https://www.ibm.com/support/pages/qradar-how-does-coalescing-work-qradar
Now, lets take the second capture and do a quick analysis:
- We can identify on the first visual a peak between 3pm15 and 3pm20 (15h15 and 15h20). This peak is over 75% of the maximum autorize by my license. Moreover, most of the events are not merged in coalesced events by QRadar.
- We pivot in the second visual in the same timestamp and we can identify from which log source the events came.
- When we check on the histogram to see raw events and coalesced events repartition we can see the same findings.
- Finally, by pivoting on the timestamp in the last visual we can retrieve the same log source found previously too.
Note: The two viuals from the bottom may appear to by redundant by they add filter more sublety than the 2 other visuals. Indeed, with the parameter we can focus the anlysis on peaks and not on license exceeding.
Before going on conclusion, here some customization you can add to the dashboard:
- Modify the temporal window (by default is 12 hours)
- Modify license thresholds in the first visual (by default 50 EPS is 100%)
- Modify the log sources we want to analyze in the visuals (by default all log sources is taken)
All of those modifications have to be made in AQL.
3. Conclusion
To conclude for this article, I hope you had learn some new things. Do not hesitate to communicate for ameliorations you may want to have in this dashboard. Finally, do not hesitate to share if you faced some difficulties to install or use this dashboard.
4. Bibliography
- IBM documentation on coalesced events: https://www.ibm.com/support/pages/qradar-how-does-coalescing-work-qradar
- Github repository that contains JSON file of the dashboard: https://raw.githubusercontent.com/staze0/QRadar/main/Pulse%20Dashboard/EPS%20Monitoring.json
Thank you for reading this article, I really hope it’s been useful! Do not hesitate commenting via the forms just below.